
Restaurant Reporting Software Is a Buyer Question
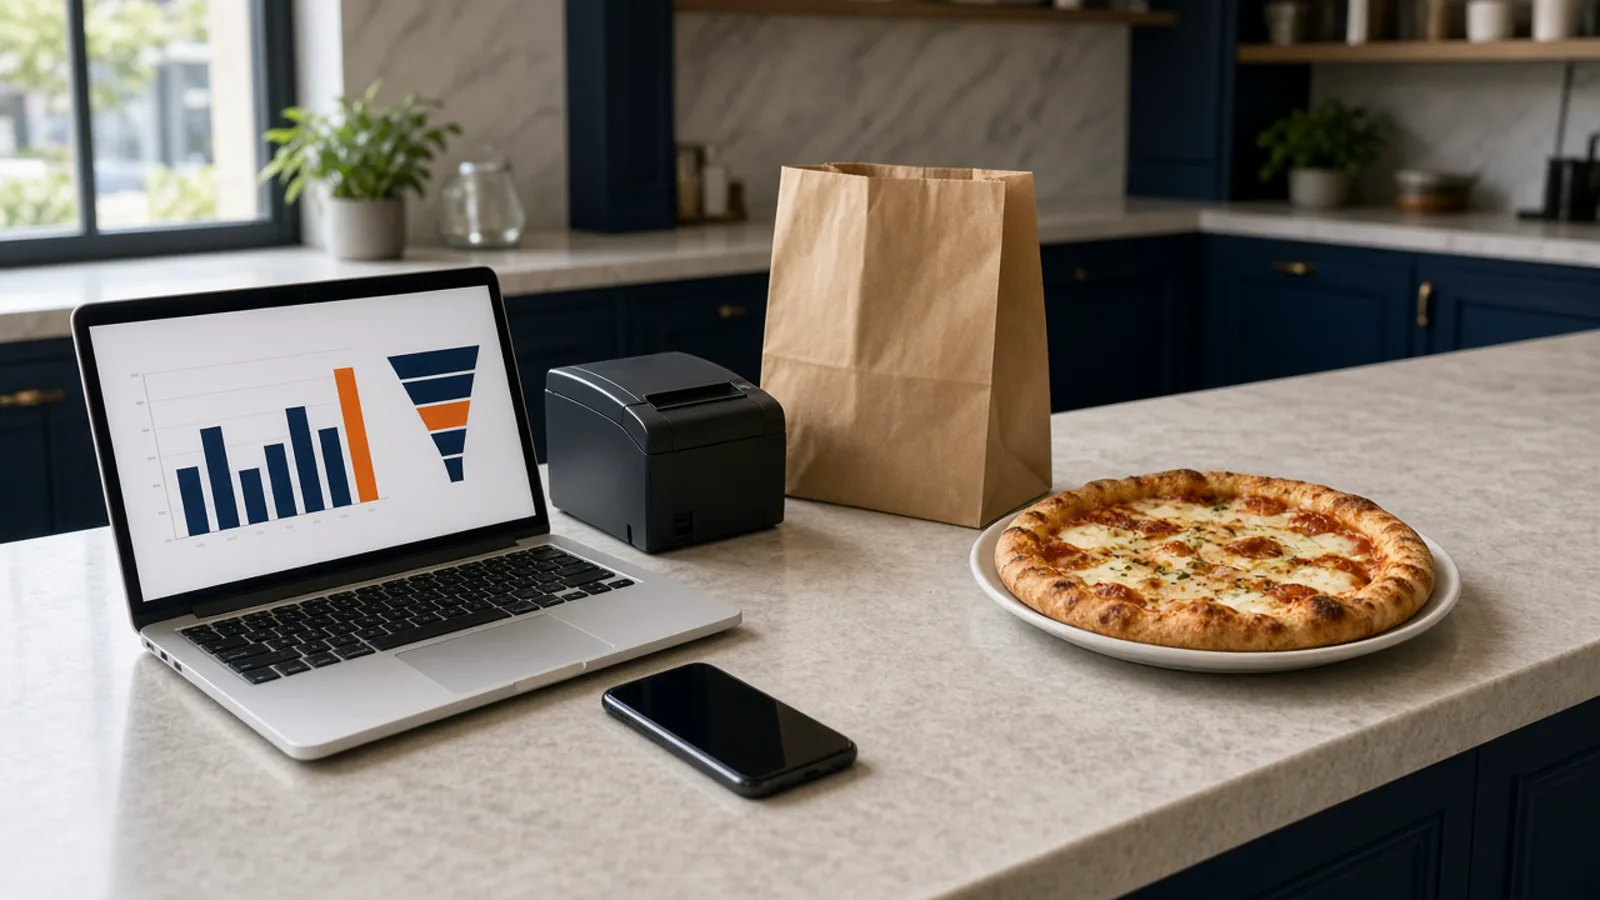
Owners who search for restaurant reporting software are often shown labor exports, food cost, and a marketplace portal that does not match the ticket on the pass. MicroSky Food is the narrower purchase. Sales reports sit in restaurant admin, in the same login as live orders and menu edits. On later plans, the checkout funnel, SEO performance tracking, and marketing campaign analytics join that login.
The weekly read of orders, average ticket, who came back, and pickup versus delivery is restaurant analytics. Whether you need a full suite or a browser admin is cloud based restaurant management software. Stay here for which report exists, and which plan includes it.
Sales Reports Sit Beside the Live Orders
On Standard, analytics and sales reporting covers orders, revenue, average ticket, and best-sellers. The same admin has the live order management dashboard. New orders appear when they are placed. Staff move each one from new to preparing to ready to delivered. Change a price, add a special, or 86 an item, and the storefront updates. If a best-seller is what you keep running out of, the person who can see the empty pan should be able to 86 it here.
Sales reports count completed, paid orders. A cart that never checked out is not in that total. Paid phone orders, after you enable Sky AI, land on the same board as website orders and print on the same receipt printer. DoorDash, Uber Eats, and Grubhub stay on their own statements. Those marketplaces often charge 15 to 30% of the sale. Add those piles yourself. This admin will not invent another company's sales.
Missed Calls Are Not a Report
Nothing in this list is a missed-call total. A ring nobody answered never became revenue, an average ticket, or a best-seller. Count the calls, then multiply by the share that would have ordered and by your average ticket. That worked example, with hypothetical inputs you replace, is what missed calls cost a restaurant. Use the sales report for orders you completed. Use the card by the phone for calls you did not take.
Conversion Rate and the Checkout Funnel
Conversion rate analytics and checkout funnel reports are on Growth, at $499 per month plus 7% of net sales, after 3 months on Standard. They are not on Standard. The admin page describes that read as visitor-to-order conversion, top-converting menu items, and checkout funnel drop-off.
The same page states a visitor-to-order target of 30 to 50%. That figure is the product target written there. It is not a result this page can promise for your week, and it is not an industry average. Standard does include a checkout described, on pricing, as built toward that same 30 to 50% product target. That line is the checkout itself. The report that shows the rate, the items, and the drop-off is the Growth report.
What the Funnel Does Not Include
The funnel is the path from a storefront visit to a paid order. It is not labor, a table turn, or a missed-call tally. MicroSky Food does not dispatch drivers or offer geofencing, and this admin is not a dining-room register.
SEO Performance Tracking in the Same Dashboard
SEO performance tracking in your dashboard is on Growth, after those same 3 months on Standard. The admin page lists the metrics as page rankings, organic traffic, and Core Web Vitals scores. Those are the reads. This page does not add a second catalog of SEO charts.
Every plan, including Standard at $249 per month plus 5% of net sales, publishes a storefront with meta tags, JSON-LD, and sitemaps. That is the site being readable. It is not the dashboard that tracks rankings, organic traffic, and Core Web Vitals. Monthly organic SEO is separate again: 5 keywords a month on Growth, and 10 keywords a month on Growth Plus. Tracking is not a promise that a phrase will rank. How a guest gets from a listing to a first order is restaurant sales funnel.
Marketing Campaign Analytics Wait for Growth Plus
Marketing campaign analytics and ROI tracking are on Growth Plus, at $999 per month plus 10% of net sales, after 3 months on Standard. That plan includes email campaigns, SMS campaigns, and push across the branded iOS app, SMS, and email. Standard and Growth do not include the analytics line, and a trial week on Standard will not show it.
The published name is marketing campaign analytics and ROI tracking. Do not invent open rates or a cost per coupon from a sales total. If you are not on Growth Plus, the send is still the box, the window, and the order link. The sales report remains the read you can open on day one.
What the Plans Cost
On pricing, Standard is $249 per month plus 5% of net sales. Growth is $499 per month plus 7% of net sales. Growth Plus is $999 per month plus 10% of net sales. Growth and Growth Plus require 3 months on Standard. A 30-day free trial does not replace those 3 months. There is no long-term contract. Hardware, if you need a mini PC print server and a receipt printer, is $500 one time.
Sales reporting and the live order dashboard are on Standard. Conversion rate analytics, checkout funnel reports, and SEO performance tracking are on Growth. Marketing campaign analytics and ROI tracking are on Growth Plus. Match the report you came to buy with the plan that lists it. The live demo is a guest storefront. Restaurants already on the platform are on clients. Menu edits and order history, as a wider buying question, are restaurant ordering software.
Open One Report Before You Add Another Tool
Start the 30-day free trial. The wizard covers your profile, menu, hours, delivery zones, and billing, and a storefront can be up in about 10 minutes. Place one paid test and open the sales report: orders, revenue, average ticket, and best-sellers. If the number looks wrong, open the orders behind it before you trust the total.
If the question that brought you here was the phone, count missed calls with the blog method before you pay for a second dashboard that still will not show them. Setup is how it works. Questions go through contact. Start 30 Day Free Trial. Call (888) 960-1359.