
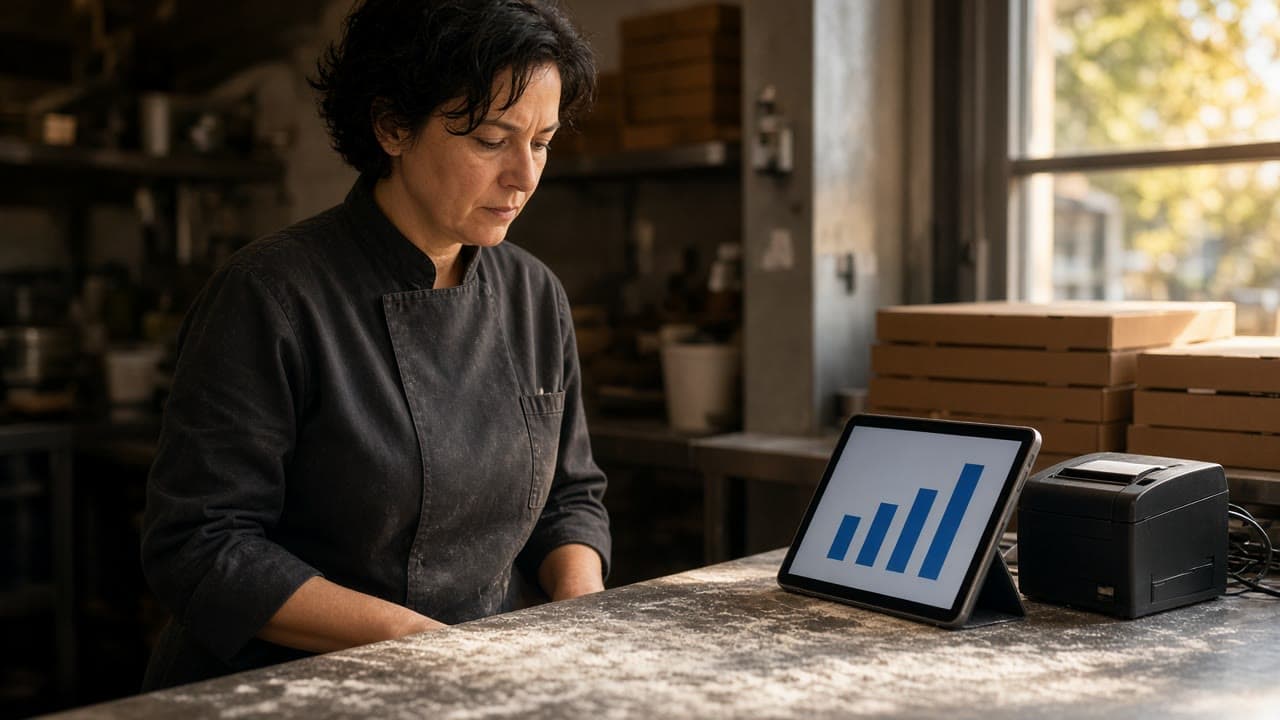
Restaurant analytics, for an independent, is a short weekly read of your own ordering door. Not a glossary of industry ratios, and not a score you are supposed to match. The useful set is small: how many orders you took, what the average order was, whether people came back, and which door they used. Then you change one thing.
This page is that weekly habit inside restaurant admin. The full tour of the dashboard, roles, and the rush is MicroSky Food restaurant admin. The monthly paper, with fees on their own lines, is restaurant profit and loss. If you are still deciding whether the door should exist, start with online ordering for restaurants.
Use the same morning and the same kind of week
Pick a quiet morning, the same weekday each time. A Monday read of a holiday weekend against a snow Monday is not a trend. Compare this week with last week, and with the same week last year only if you actually have it.
Reports can sit two date ranges side by side, and they follow your restaurant's time zone. Sales reports count completed, paid orders. A cart that never paid is not an order. If a dashboard total looks surprising, open the list behind the number, which the release notes describe.
Write the four numbers in the same place every week. A notes app is enough. Next month you should be able to see what you changed.
Start with orders
The first number is the count of completed, paid storefront orders in the range you chose. Revenue without the count hides whether you got busier or just sold a few large trays. The count without revenue hides a week of tiny tickets.
If orders fell, look at causes you can see. Were you closed a day you are usually open? Did someone 86 a plate and leave it off? Did hours close the cart while the dining room was still seating? The storefront follows the hours and the menu you saved. A missing link on the Google listing is not a kitchen problem. Check the door before you rewrite the menu.
If orders rose, do not celebrate with three changes. Note what was different: a special, a storm, a school night, a link you finally put on the box. One of those is the candidate. You will test it next week by leaving the others alone.
Average order value is the average ticket
Average order value is the average ticket on that same sales report, beside orders, revenue, and best-sellers. It is your storefront, after the report's own rules for completed, paid orders. It is not the dining room, and it is not a marketplace.
Read it only against your own last week. A published average will not know that you sell slices at lunch and whole pies at dinner. If the average jumped because of one catering tray, open the list and say so in the note. If it fell because a coupon trained people to order only the cheap item, that is a decision, not a mystery.
Best-sellers tell you what to change
When the average moves, open best-sellers before you touch prices. The report is there so you can see which plates did the moving. A hero item that vanished is either sold out, hidden, or no longer the thing people came for. A new item at the top is either a hit or a discount.
One action is enough. Feature the plate you can cook well and want more of. Or take the discount off the item that is pulling the average down without bringing new people. Change the menu in admin and the storefront updates. You should see the effect in next week's orders and average, or you should undo it.
Repeat guests, counted from your own names
Repeat rate is the question 'who came back,' not a trophy percent. Restaurant admin does not hand you a single repeat-rate score to quote. Do not invent one, and do not download an industry repeat rate to feel behind.
While people are ordering, live checkouts can label a checkout as a regular customer or a guest. That label is about the cart in front of you. It is not a percent for a week that already closed. For the closed week, open the orders and the customers section and count names you recognize, or orders from accounts that have ordered before. Write '18 of 70 orders were people we know' if that is what you counted. That sentence is your repeat read.
If the count is thin, the next step is the reorder, not a new slogan. Accounts and saved orders are on every plan. Loyalty points accrue on storefront purchases, and you set what they are worth. Put the order link where a regular already looks: the box, the receipt, the Google order link. Email and SMS campaigns are on Growth Plus, at $999 per month plus 10% of net sales, after 3 months on Standard. Do not plan a text blast on Standard and then discover the tool is not on that plan. See pricing.
Channel mix is the doors you actually run
Channel mix means which door the order used. On your site, the split that matters most weeks is pickup versus delivery. The orders page can show today's deliveries and pickups together. For the week, use the orders in the range you already chose and separate those two. If you do not see a pie chart, tally it. A tally you trust beats a chart you hoped for.
Phone is the other door you control, once Sky AI is on. It answers unlimited inbound calls, with no per-minute fee, and the paid ticket lands on the same board and prints with web orders. Turn it on after onboarding, in Admin, then Integrations. It is not part of the signup wizard. If you need web versus phone, mark it while you read the week's orders. Do not assume a chart you have not opened.
Marketplace orders are not in this admin. DoorDash, Uber Eats, and Grubhub reports stay on their statements. Those companies often charge 15 to 30% of the sale, and your contract beats that range. Add their order count next to yours on the notebook line. If their pile is most of the week and yours is a trickle, the work is the link and the reorder on your site, not a new name for the ratio. MicroSky Food does not dispatch drivers, track them, or offer geofencing. Delivery is the zone, radius, and fee you set.
Leave the Growth reports for a later week
Two more reports exist, and they are not the weekly four. Restaurant admin describes conversion rate analytics as visitor-to-order rates, with a target of 30 to 50% named on that page, plus top-converting items and checkout drop-off. It also describes SEO performance tracking for rankings, organic traffic, and Core Web Vitals. On pricing, those reports come with Growth, along with monthly work on 5 keywords. Growth Plus keeps them and works 10 keywords.
Standard includes the sales report this habit uses: orders, revenue, average ticket, and best-sellers. If you are on Standard, do not spend the morning hunting a funnel that is not on the plan. If you are on Growth, read the funnel after the four numbers, and only when checkout is the question. A quiet week of orders is not fixed by staring at a ranking.
Change one thing, then read it again
End the page with a single sentence: what you will do before next week's read. Feature one plate. Fix the hours. Put the link on the box. Turn a sold-out item off. If you change the special, the coupon, and the delivery radius in the same week, the next read cannot tell you which one moved.
The storefront those numbers describe is the branded site, and on Growth and Growth Plus a branded iOS app after 3 months on Standard. What that guest-facing door includes is food order application. Setup, including the wizard, hours, and zones, is how it works. Restaurants already on the platform are on clients. Questions go through contact. The live demo is a storefront on a phone.
On Standard, choose $249 per month plus 5% of net sales, or $499 per month flat. Growth is $499 per month plus 7% of net sales. Growth Plus is $999 per month plus 10% of net sales. Growth and Growth Plus require 3 months on Standard. Apple Pay is on Growth and Growth Plus, through Authorize.net. Hardware is $500 once if you need a mini PC print server and a receipt printer. There is a 30-day free trial and no long-term contract. Start 30 Day Free Trial. Call (888) 960-1359.